What you’re missing without profiling: An Introduction to Pyroscope
Profiling is the missing piece in your observability puzzle.
In my previous blog post, we explored the concept of profiling as a key element of observability beyond the three pillars. We talked about how profiling can help you better understand your application’s behavior and performance and how it can help you identify and resolve performance bottlenecks.
Today I’d like to introduce you to Pyroscope, a powerful and easy-to-use profiling tool that can help you take your observability stack to the next level.

What’s Pyroscope
Pyroscope is a powerful and easy-to-use profiling tool that can help you take your observability stack to the next level. Pyroscope is a sampling-based profiling tool that allows you to profile your applications and infrastructure with minimal setup, and it provides a user-friendly interface for exploring the data that it collects.
Why Pyroscope
With Pyroscope, you can check how well your app is running in different ways, like flame graphs and call graphs. And the best part is that Pyroscope doesn’t slow down your app with a bunch of extra stuff.
Its sampling-based profiling approach has little impact on the application performance, requires little setup and configuration, and integrates seamlessly with popular program languages and observability tools like Grafana.
Pyroscope Architecture
Pyroscope is an excellent tool for profiling applications and better understanding their performance. But how does it work? It has a distributed architecture comprised of several components that all work together to collect, process, and display profiling data.
The image below illustrates very well Pyroscope’s architecture, but now let’s describe the components.
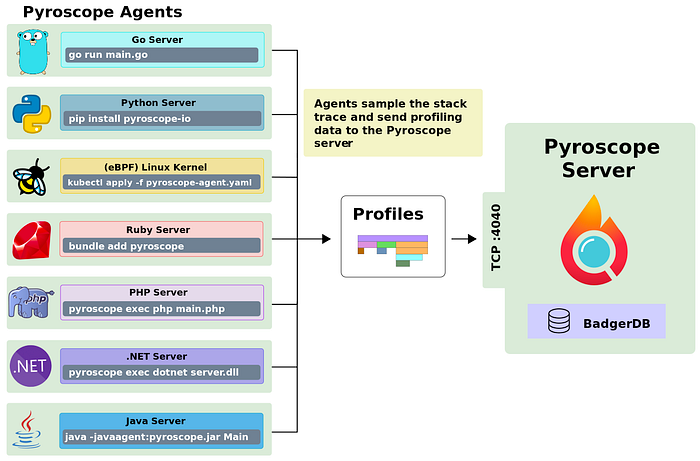
Agent
This is a little piece of software that you run alongside your application. It’s kind of like a spy that watches what your code is doing and takes notes. Every once in a while, the agent takes a snapshot of what’s happening in your code and sends it over to another part of the machine called the server.
Server
The server is like the brain of the machine. It takes all of the snapshots that the agent sends and puts them together into a big picture of what your code is doing. It’s kind of like a giant puzzle where each snapshot is a piece, and the server puts them all together to make a complete picture.
Storage
This is where all of the snapshots that the agent sends to the server are stored. By default, Pyroscope uses a database called badger to store the snapshots, but you can also use the remote writer option to export the data to other sources.
UI
The UI is like a big screen where you can see different views of the picture. You can look at things like flame graphs, and call graphs to get a better understanding of how your code is performing.
Setting up Pyroscope
I know you’re here to see the magic happen, and I believe you already have enough information about what Pyroscope is and why you might want to use it. So let’s roll up our sleeves and install Pyroscope, along with a demo application, to see some action!
Spin up a Kubernetes cluster.
The first thing we need to do is to prepare a minikube cluster to host the Pyroscope components, and this can be easily achieved by running the following command.
minikube startInstalling Pyroscope server
Now that you have your minikube cluster up and running, it’s time to add Pyroscope’s helm repository. This will allow you to easily install Pyroscope and take advantage of all its features.
helm repo add pyroscope-io https://pyroscope-io.github.io/helm-chartNow, all it takes is one simple command to get a Pyroscope server up and running on your local environment! And the best part? The Pyroscope helm chart is already set up to work seamlessly in a local environment, so you won’t need to fiddle around with any helm values.
helm upgrade -i pyroscope-server pyroscope-io/pyroscopeJust to ensure that everything is up and running, run the command below and check the pod status.
kubectl get pods
----
NAME                                READY   STATUS    RESTARTS   AGE
pyroscope-server-775449cc86-8cms2   1/1     Running   0          67s
Accessing Pyroscope’s UI
When running Pyroscope with default configurations and without enabling the ingress option on the Helm chart, we cannot access the Pyroscope UI via URL. In this case, we need to port forward the Pyroscope pod to our local machine to access the UI.
kubectl port-forward svc/pyroscope-server 4040Great news, you’re all set up to start using Pyroscope! To access the Pyroscope UI, just click on this link. Once you’ve done that, the UI will open up, and you’ll see a screen that looks something like the image below.
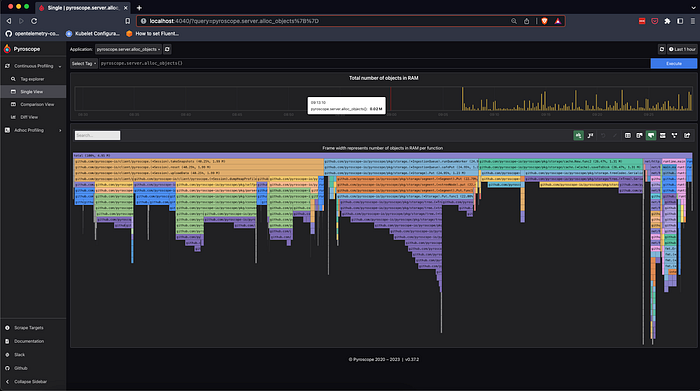
Hey, you might be curious about the flame graph you’re seeing on the Pyroscope homepage, right? But here’s the thing, you haven’t even run any application inside the cluster yet! Don’t worry, Pyroscope is using itself to collect its profile data. This is called “dogfooding" in the product development world, and it’s something I love.
Installing a demo Application
Cool! Now we have a Pyroscope Server up and collecting its profiling samples, which is cool and can already show us some great potential but now, before we see more magic happening, we need to deploy a demo application on our Kubernetes cluster, and you can do it just using the command below.
kubectl run hotrod --image jaegertracing/example-hotrod:latest --port 8080 --exposeThis command is going to fire up a super cool demo app called HotRod. You might have heard about it before, as it’s a bit of a celebrity in the distributed tracing world. You’ll find it featured in all sorts of blog posts and tutorials on the topic.
To access the HotRod application, we can use the same port-forward strategy we used with Pyroscope, by using the following command.
kubectl port-forward svc/hotrod 8080:8080So then, you will be able to see a screen like the following one.
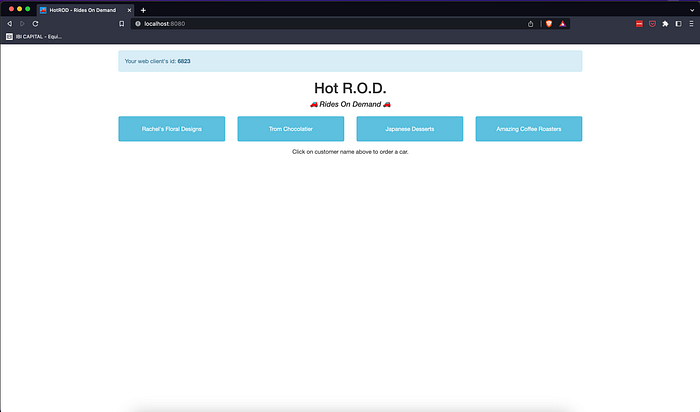
This is just a regular go app, without any Pyroscope code modifications, which is pretty cool because it showcases Pyroscope’s true power during the next steps.
Pyroscope eBPF
Pyroscope offers two strategies to profile applications, first one is a native profile, which implies having an agent installed on your application, or eBPF profiling, which leverages the Linux kernel to collect out-of-the-box profiles from your application.
There’s nice content published on Pyroscope’s blog describing the pros and cons of each strategy supported, and you can check this by clicking here.
Well! since the application we’re using (HotRod) there’s no Pyroscope agent installed, we’re going to use the eBPF profile feature available, to see how to achieve continuous profiling with no code changes, which I love and it’s very aligned with my posts about “Observability strategies to not overload engineering teams".
Pyroscope eBPF Agent
To leverage the Pyroscope eBPF agent, we need first install it on our cluster, an agent that will run as a daemon set, which means we will have an instance on every Kubernetes node on the cluster.
helm upgrade -i pyroscope-ebpf pyroscope-io/pyroscope-ebpfAfter installing it and spending a couple of minutes using the HotRod, we will be able to see the CPU profiling from our pod on Pyroscope as in the image below.
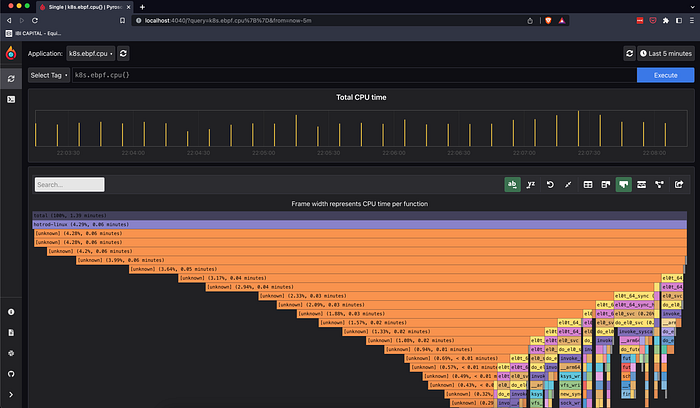
This is the flame graph for the HotRod CPU usage during the last 5 minutes, to be honest, this is cool to get this kind of information without any code changing.
You might be wondering why we have a lot of unknowns on the flame graph, this is because eBPF relies on debug symbols to show the proper information, and in this case, we don’t have the debug symbols for the demo application.
What’s next
Looks like I wrote an entire book, and it’s time to give you some time to process all the information available here.
This blog post is just a small introduction to show you the Pyroscope’s potential, on the next blog post, we will the difference in profiling applications using native profiling with a Pyroscope agent injected into the application code.
I hope you enjoy it! 😄
Do you plan to use it?
Let me know in the comments down below.